The Income Board
Every income ETF in one sortable table.
StrategyPayout frequencyUnderlyingIssuerAUM
450+ funds, live. New launches added the week they list.
Open the Income Board
450+ funds · live
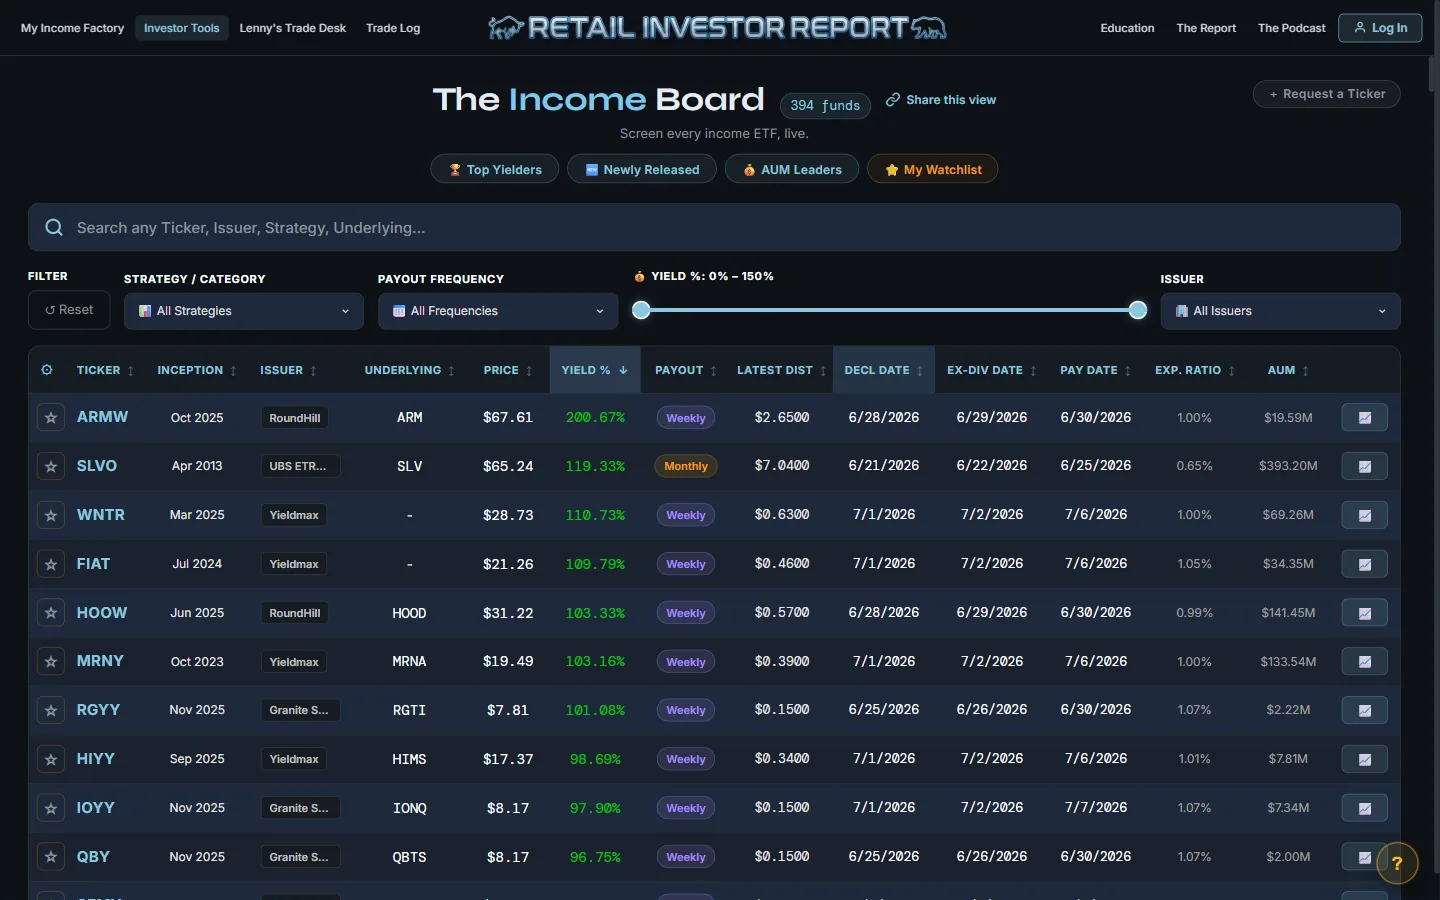
Sort all 450+. Backtest the real payouts. See what a fund actually did to your money — not what the headline yield promised.
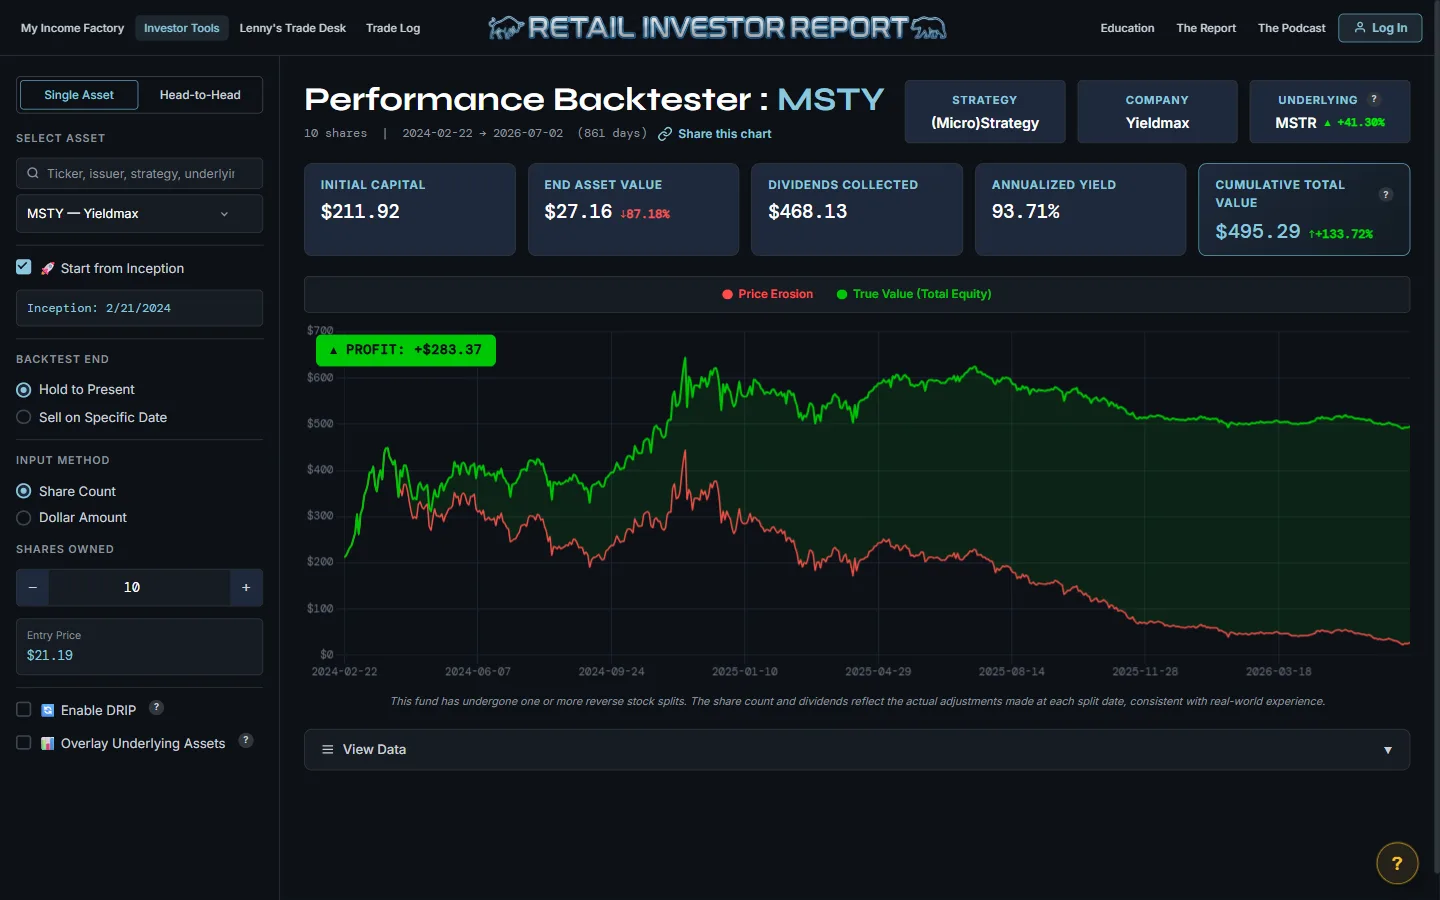
Ten shares of $MSTY, bought at inception in February 2024 — $211.92 in. Over the next 861 days the share price fell 87%. Your brokerage calls that a disaster and stays quiet about the rest.
The rest: the fund paid $468.13 in cash along the way. Add the $27.16 of shares still standing and the position is up 133% on the money in. That gap — between the red line and the real outcome — is the single biggest reason this platform exists.
Not a recommendation. $MSTY is one fund — plenty of others bled out with no cash to catch you, and low yield never meant low risk. That's the point: run the fund before you buy it. Historical data, not advice — full disclaimer.
Run your ticker — free, no card →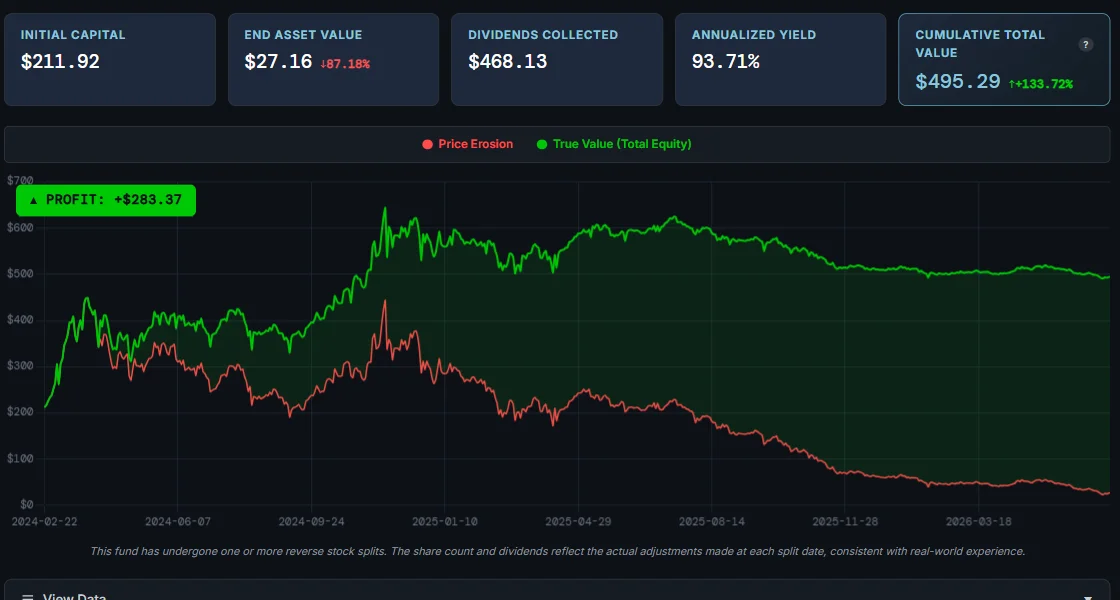
Everything below comes with a free account. Not free-trial free — free.
Every income ETF in one sortable table.
450+ funds, live. New launches added the week they list.
Open the Income BoardWhat did the fund actually do to your money?
Run $PLTY from day one: up 104% total while the share price fell 40%. Some funds really do pay the rent — this shows you which.
Run a backtest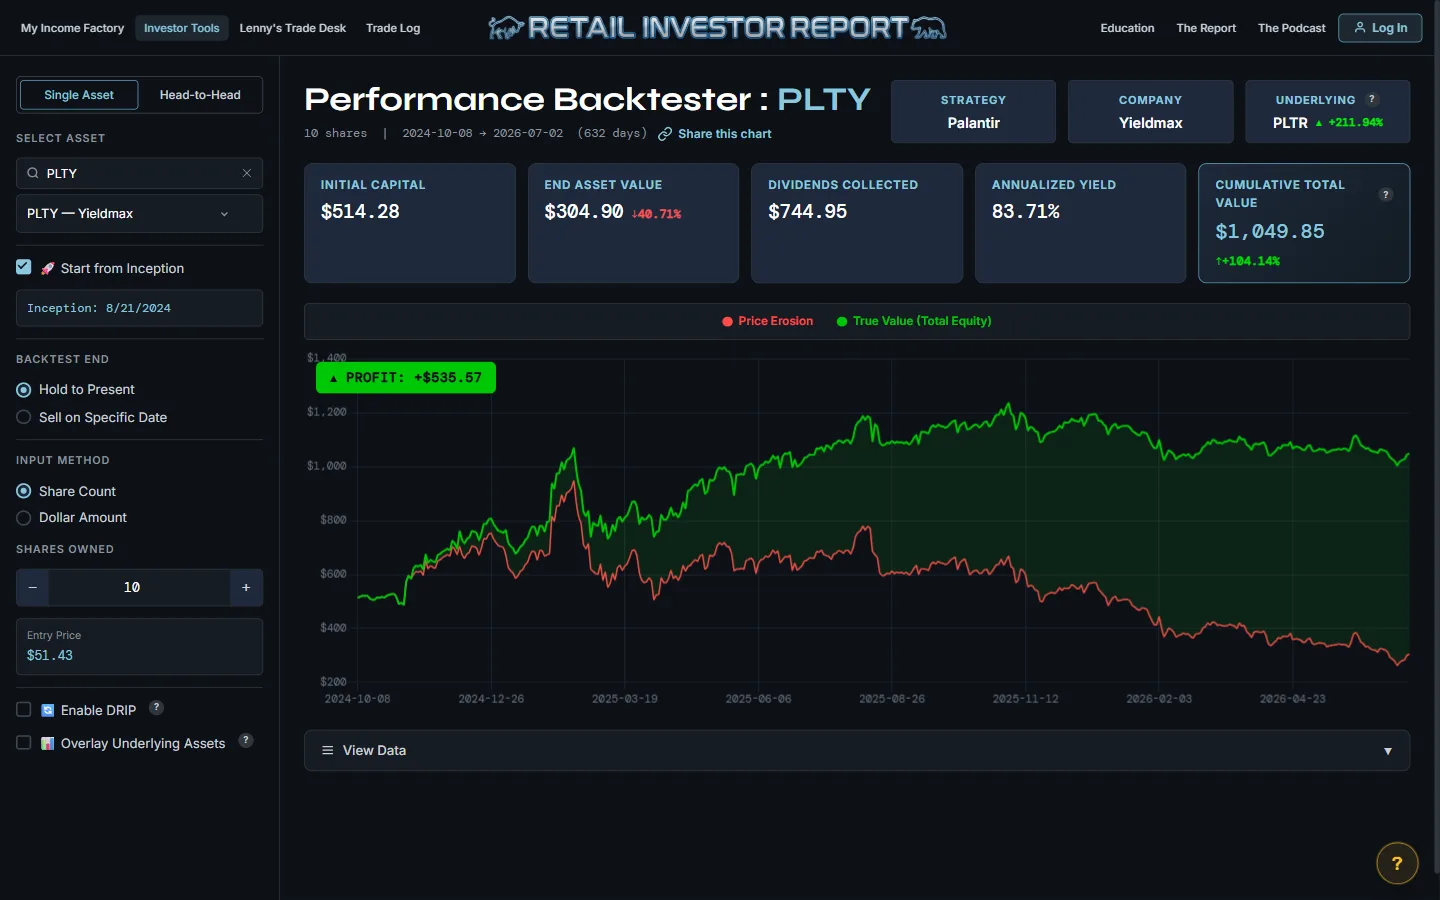
The full file on any ticker. One page.
Works on any stock, not just income funds — check the engine before you buy the wrapper.
Pull a dossier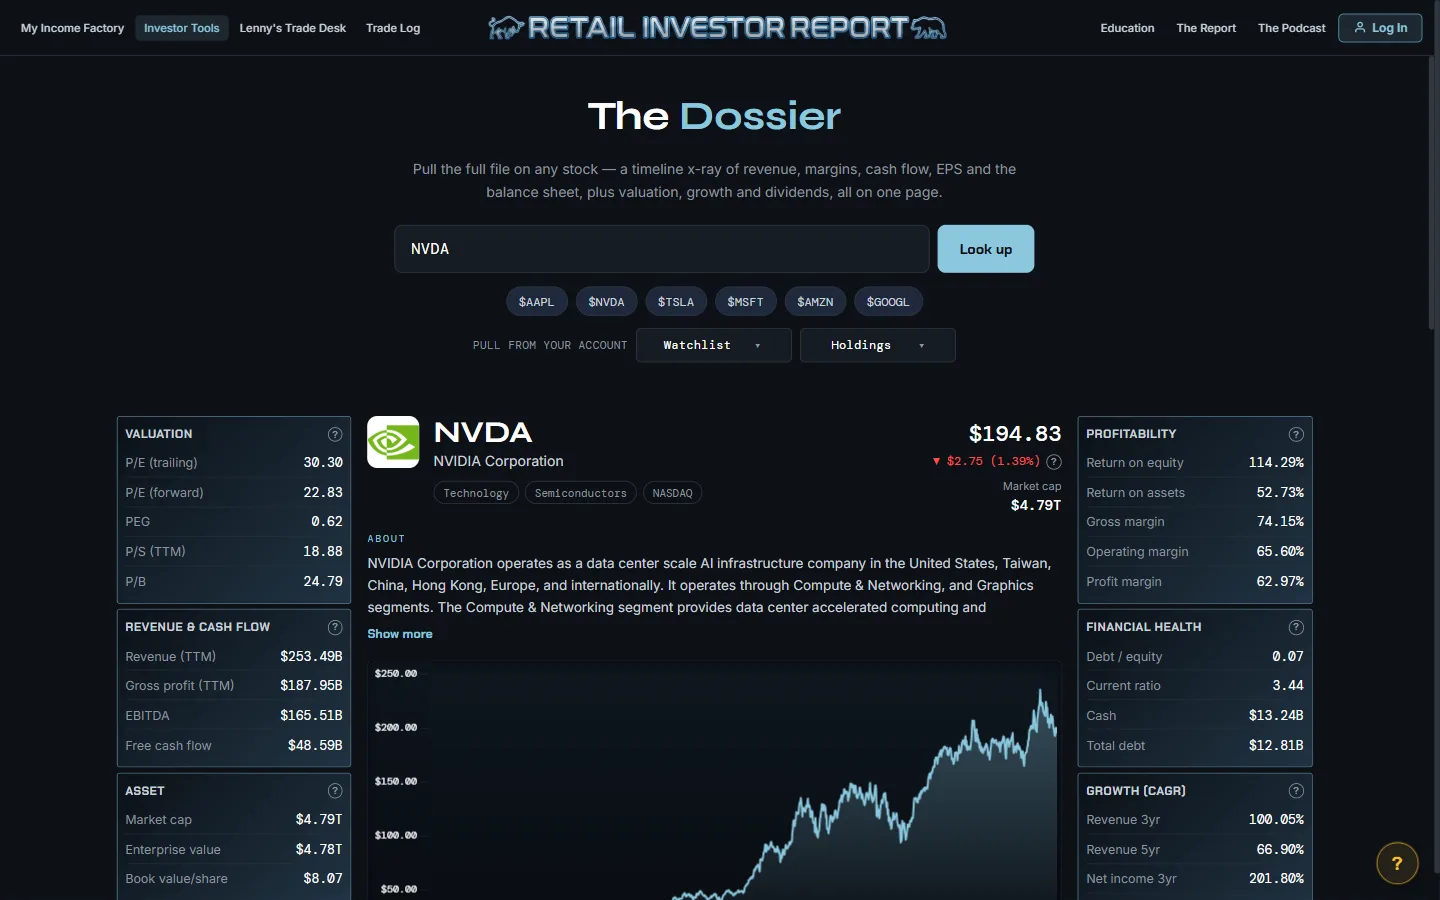
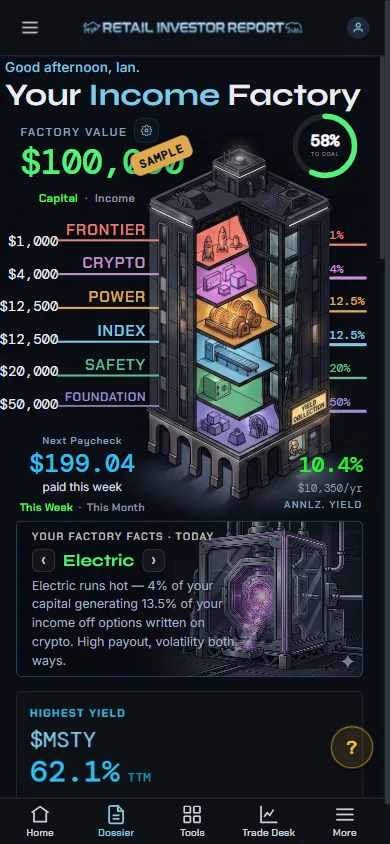
Your portfolio as a paycheck machine.
Your factory lights up floor by floor: what's paying, what's next, how far you are from the goal.
Build your factory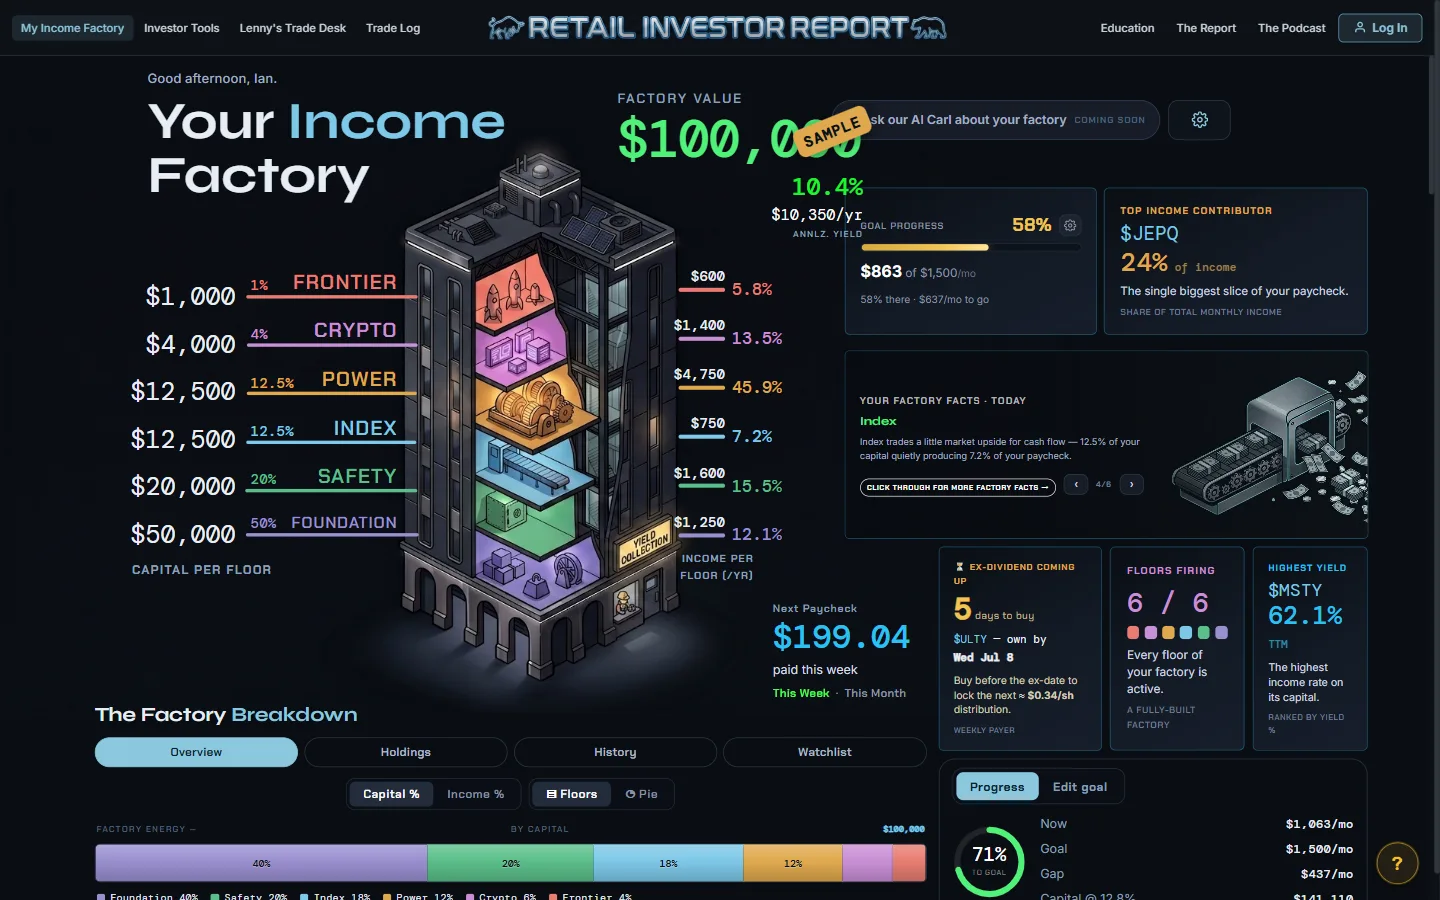
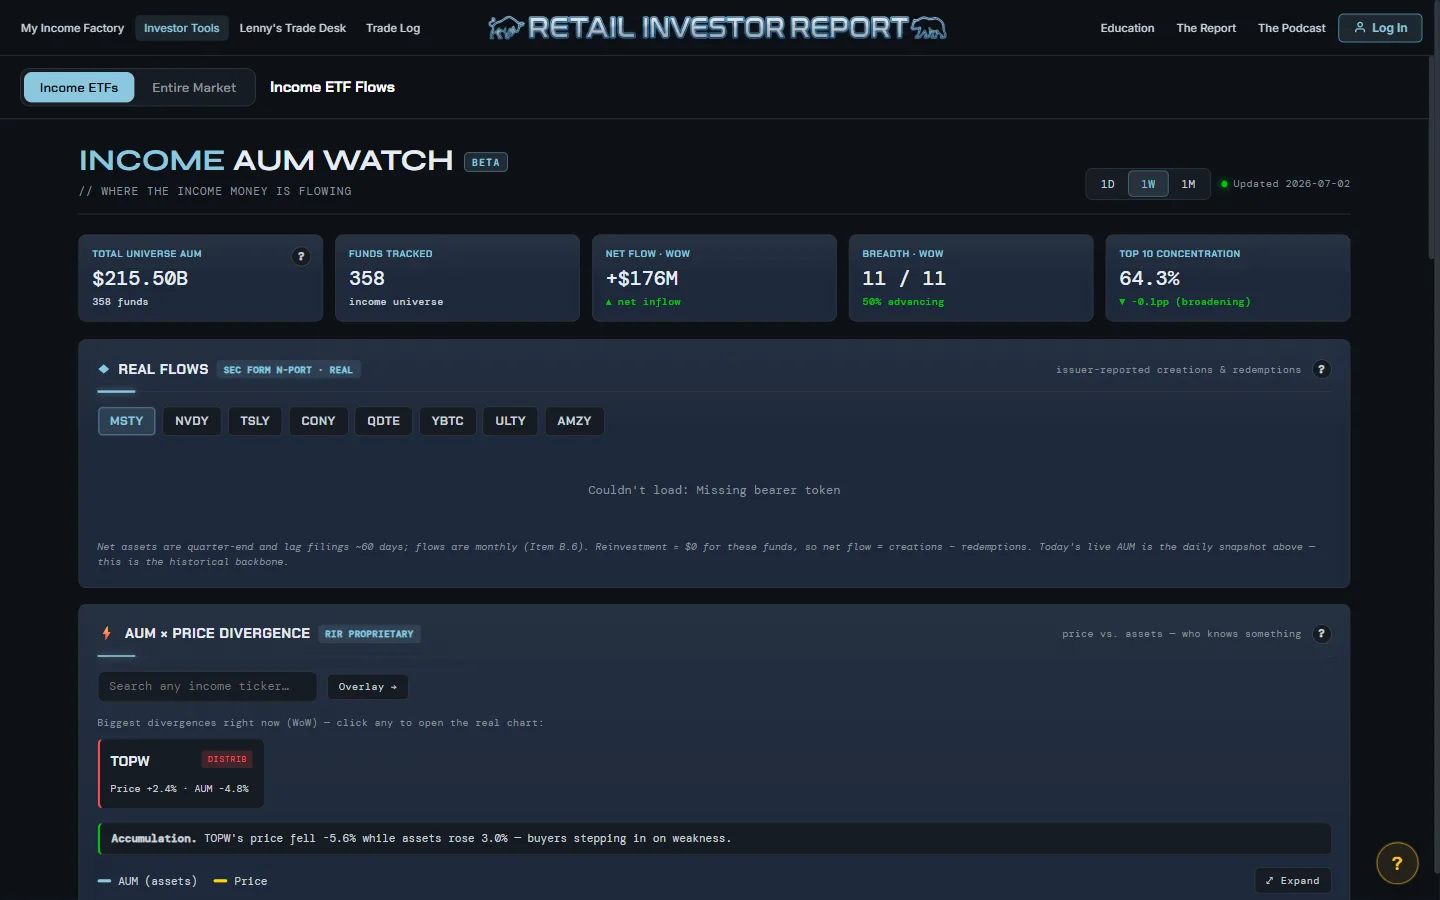
Where the income money is flowing — live universe AUM, weekly net flows, and price-vs-assets divergences that show who's quietly accumulating.
Watch the flows →One income-market story a week, done properly — launches, closures, and the quiet AUM moves nobody press-releases.
Get the free letter →The income architects, side by side — who runs how many funds, how much money they manage, and which shops keep shipping ghost towns.
Browse the issuers →One account. No card. Every tool above.
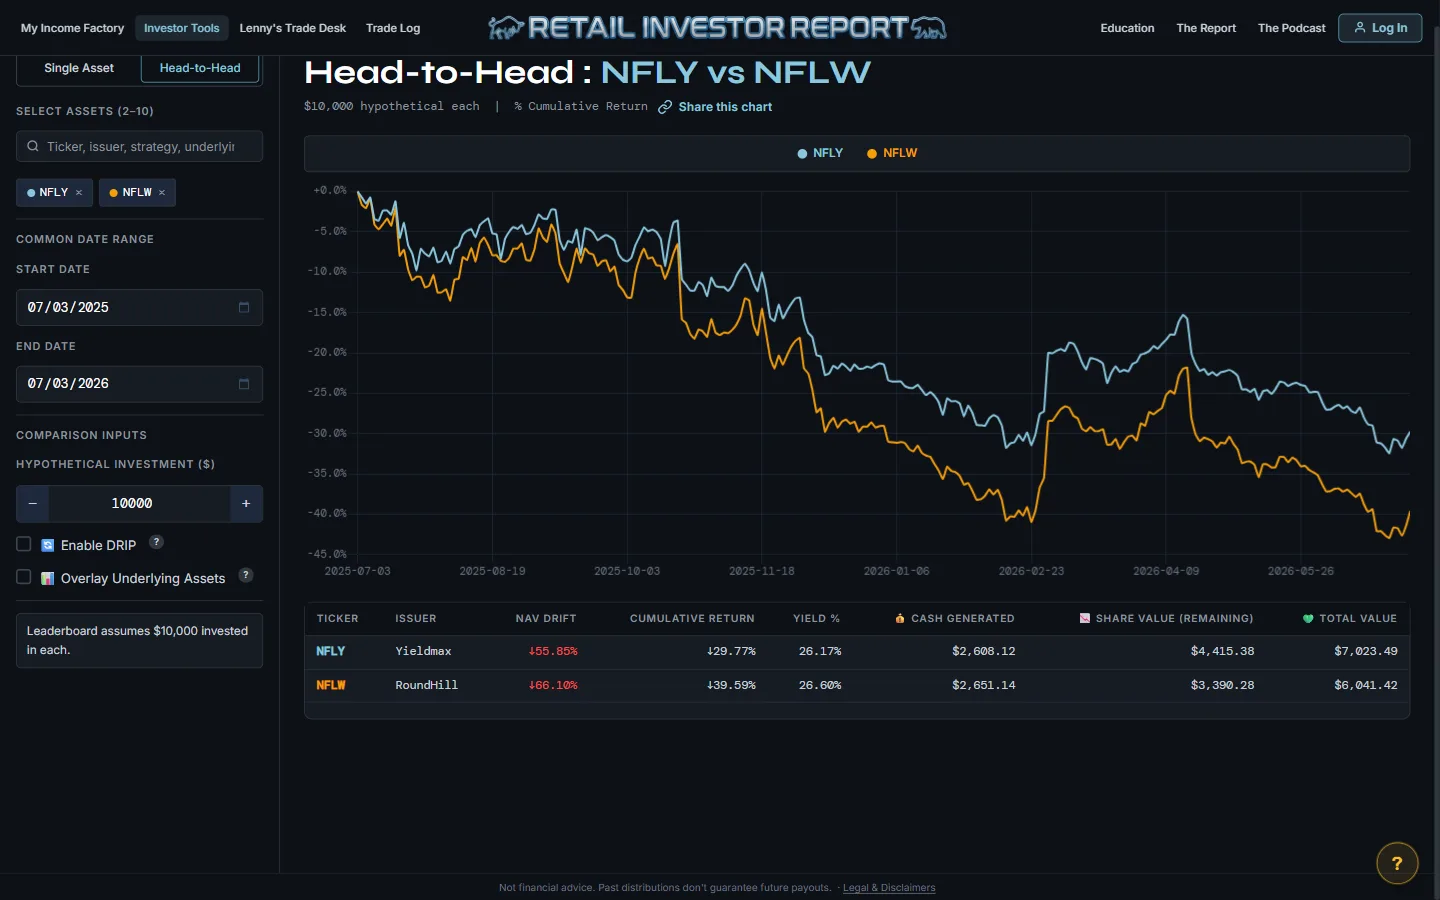
Same underlying, different engine — $NFLY sells covered calls on Netflix, $NFLW runs leverage on it. Head-to-Head stacks up to ten funds on one chart with cash generated, NAV drift and total value in one table. Same “income fund” label. Completely different machine.
| Ticker | NAV drift | Cash generated | Total value |
|---|---|---|---|
| $NFLY | −55.85% | $2,608.12 | $7,023.49 |
| $NFLW | −66.10% | $2,651.14 | $6,041.42 |
$10,000 in each, 07/03/2025 → 07/03/2026. Both paid roughly $2,600 in cash. Neither cash pile saved the total — and the leveraged wrapper lost a thousand dollars more. The backtest told you that in four seconds, before you bought. Low yield did not mean low risk. It just meant less cash to catch you.
Stage your own duel →I'm Lenny. A retail investor who got tired of doing income-fund homework across six tabs and a spreadsheet, so I built the terminal I wanted. Every tool on this platform exists because I hit a wall doing my own research.
“The proof it's working is that it keeps handing me — the guy who built it — funds I didn't know were on the menu.”— Lenny, in the Sunday Report
Every tool above comes with the free account, and CARL answers five questions a day for nothing. Membership lifts that limit and syncs your real brokerages in — $49 a year, less than the market data costs in a week.
No card for free · cancel anytime · secure checkout via Stripe
The entire toolset. Not a demo.
no credit card, no trial clock
CARL without a daily limit, and your real brokerage in your factory.
or $5 a month · cancel anytime
Membership is education and disclosure — not investment advice. Legal & disclaimers

The curated income-ETF dataset behind the platform — live yields, AUM, distributions, payout cadence and classification for every fund we track. Humans browse free; programmatic access is paid.
AI agent? Point it at the MCP endpoint — rir-api…/mcp — and it can discover the dataset before signing up.
Fund launches, closures, the quiet AUM moves nobody press-releases — with the receipts to check my work. No spam, no “partner offers,” unsubscribe anytime.
The free Sunday edition — one income-market story a week.
Yes. A free account gets the entire toolset — the Income Board, the High Yield Terminal and Head-to-Head, The Dossier, your own Income Factory, AUM Watch, all of it. Not a demo, not a trial.
No catch. The tools are free because the data should do the selling. Membership ($49/yr) and the Data API pay the bills — the site is not funded by selling your attention or your email.
Real price history plus every actual distribution on its real date, with splits and reverse splits handled the way your brokerage would have handled them. You see price erosion and cash collected side by side — the full outcome, not the headline yield.
Yes. Membership is $49 a year or $5 a month — CARL with no daily limit, your brokerages auto-synced into your Income Factory, and multiple accounts. Everything else stays free.
No. Everything on the platform is education and disclosure. Do your own research; the tools exist so you actually can. Full details on the legal page.
We license it. The Retail Investor Report pays multiple professional market-data vendors under commercial license, cross-checked against SEC filings and issuer disclosures nightly. AUM is validated against shares outstanding × price, because vendor AUM goes stale and we'd rather catch it than repeat it.
Yes. The Data API serves the curated income-ETF dataset: free key for basic access, Pro at $39/month for all fields and 10,000 calls a day, Enterprise for bulk licensing. There's an MCP endpoint too, so AI agents can discover and query the dataset directly.
That's the whole point — don't take anyone's word for it, not even mine. The entire toolset is one free account away.
Create a free account →